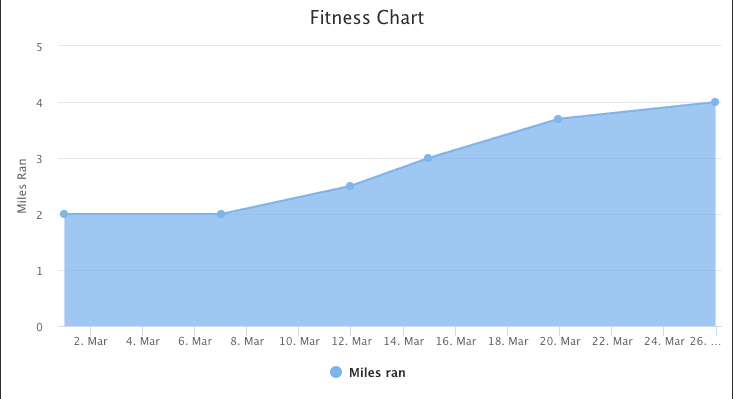
A Simple Time Series Area Chart with ember-highcharts
I recently had a project where I had to render a simple time series chart. After some research on emberobserver.com, I had decided to go with ember-highcharts. I've used the javascript library in the past, but this was my first time using the ember addon. Since there isn't too much documentation, I had to play around with some of the examples here. Eventually I had a simple time series chart. The following is a quick tutorial way to get one rendering.
Install ember-highcharts
ember install ember-highchartsCreate a component that extends Highcharts
In this example, we'll call the component FitnessChart.
ember g component fitness-chartIn the component, extend the Highcharts component from ember-highcharts
import Highcharts from 'ember-highcharts/components/high-charts';

export default class FitnessChart extends Highcharts {
}
Set up chartOptions
You can see more information in the highcharts documentation, but here's a quick bit of code to get up and running
import Highcharts from 'ember-highcharts/components/high-charts';

export default class FitnessChart extends Highcharts {
  chartOptions = {
    chart: {
      type: 'area'
    },
    title: {
      text: 'Fitness Chart'
    },
    xAxis: {
      type: 'datetime'
    },
    yAxis: {
      title: {
        text: 'Miles Ran'
      }
    }
  }

  content = []
}
Caveat
At the time of writing this, the Highcharts component is still using @ember/component as its base class. I'm using the newer syntax that I normally use for Glimmer components and got confused why things like this.args weren't available. To get a chart rendering though, we can just use static values.
Passing in data
Now we can render our component like this
<FitnessChart @content={{this.chartData}} />where chartData is something like this
import Component from '@glimmer/component';

export default class ParentComponent extends Component {
  chartData = [{
    name: 'Miles ran',
    data: [[1519891200000,2],[1520409600000,2],[1520838000000,2.5],[1521097200000,3],[1521529200000,3.7],[1522047600000,4]]
  }]
The data is in the format
[
  [timestamp, milesRan],
  [timestamp2, milesRan2]
]
where timestamp is a unix timestamp in milliseconds
The resulting chart should look something like this

Hopefully you can quicky get a chart rendered and alter it to your requirements without having to start from scratch and play around with the highcharts documentation/examples.